


.svg)
.svg)
Metrus Impact Report
Investing in Energy as a Service
We are leading the way to a sustainable, low-carbon future by bringing energy efficiency and clean energy projects to life.


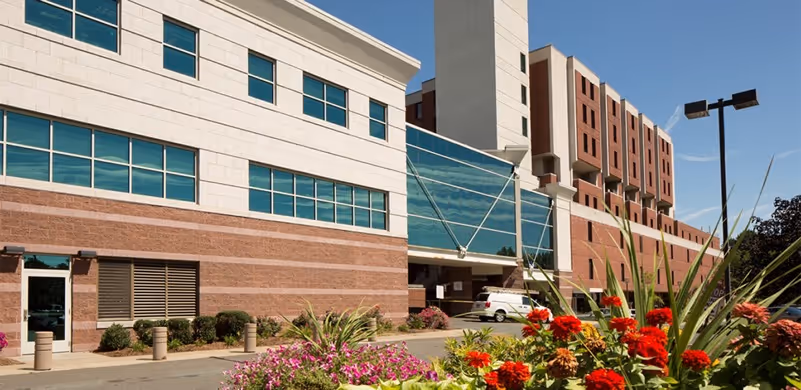
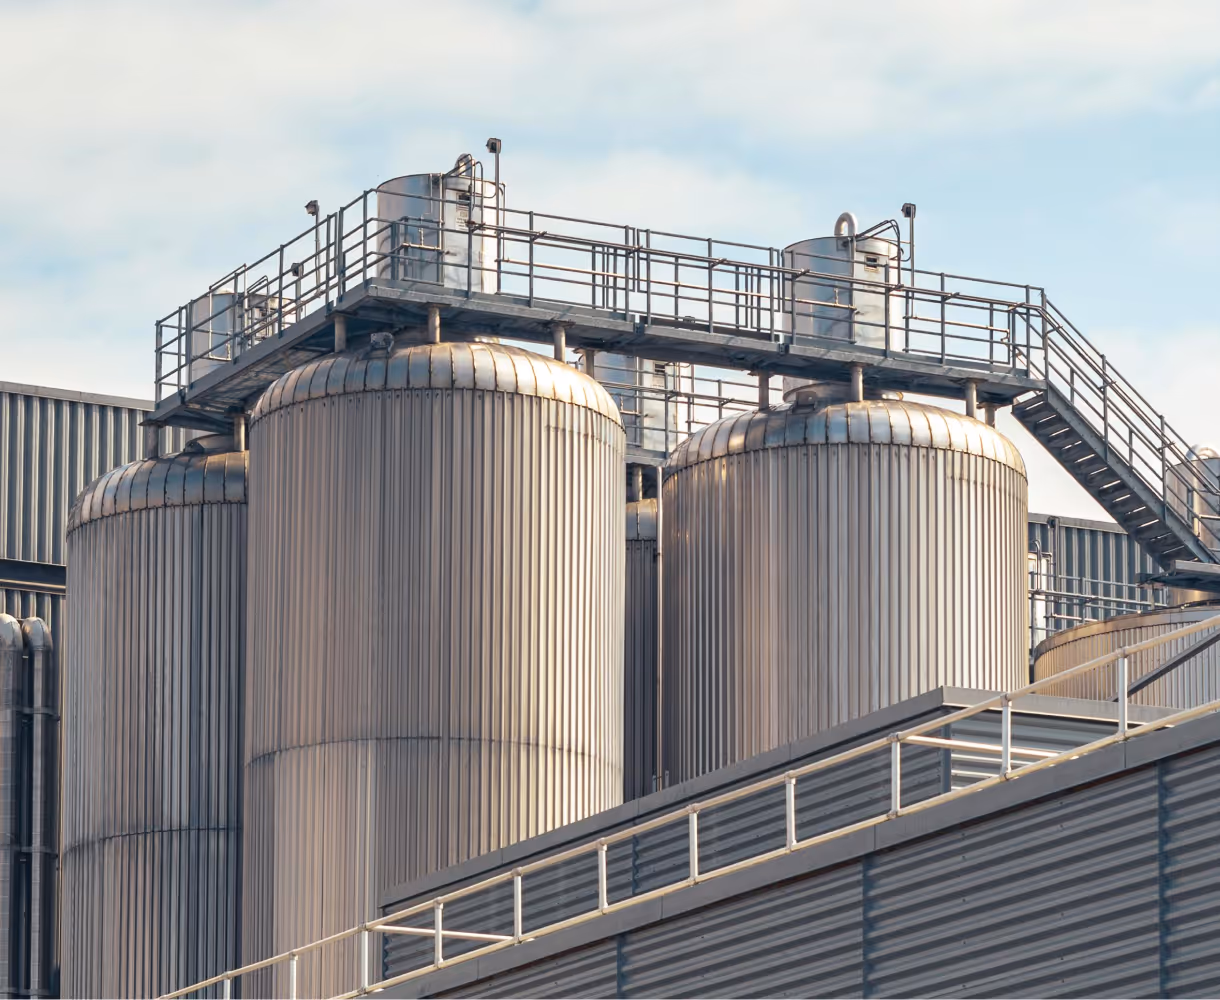
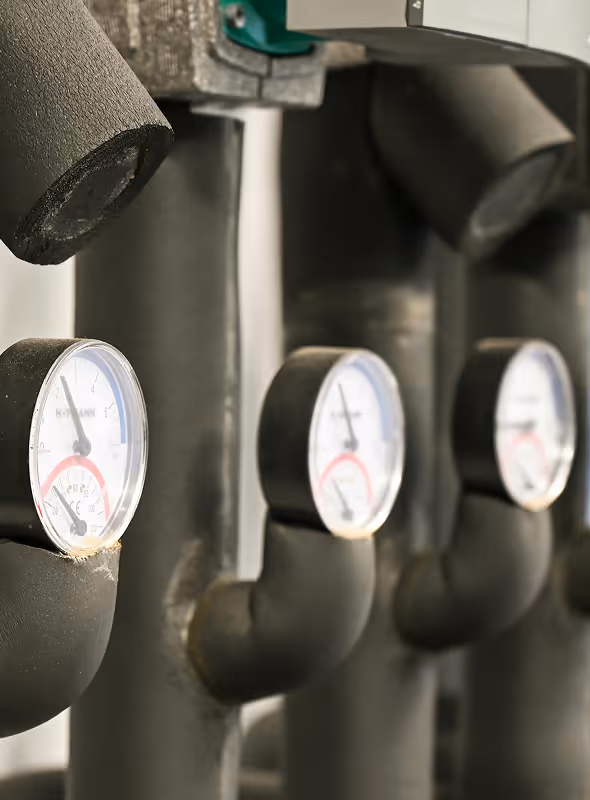
Metrus has operational Sustainable Energy Services Agreement (SESA) projects in 34 states, encompassing more than 940 sites.1 Our portfolio consists of over 30 different types of energy-efficiency measures and technologies.
Energy Efficiency Measurements (EEMs)
Nearly half of our projects feature three or more EEMs, which is consistent with our efforts to bundle upgrades with varying economic and technology profiles to achieve scale. Ninety-eight percent of our projects include lighting, reflecting both its crucial value to customers and its economic importance to unlocking deeper energy retrofits. SESA projects for private sector business, education, and healthcare customers are all represented in the 8+ category. The 23% of our projects with a single EEM are predominantly for warehouse and distribution center clients.

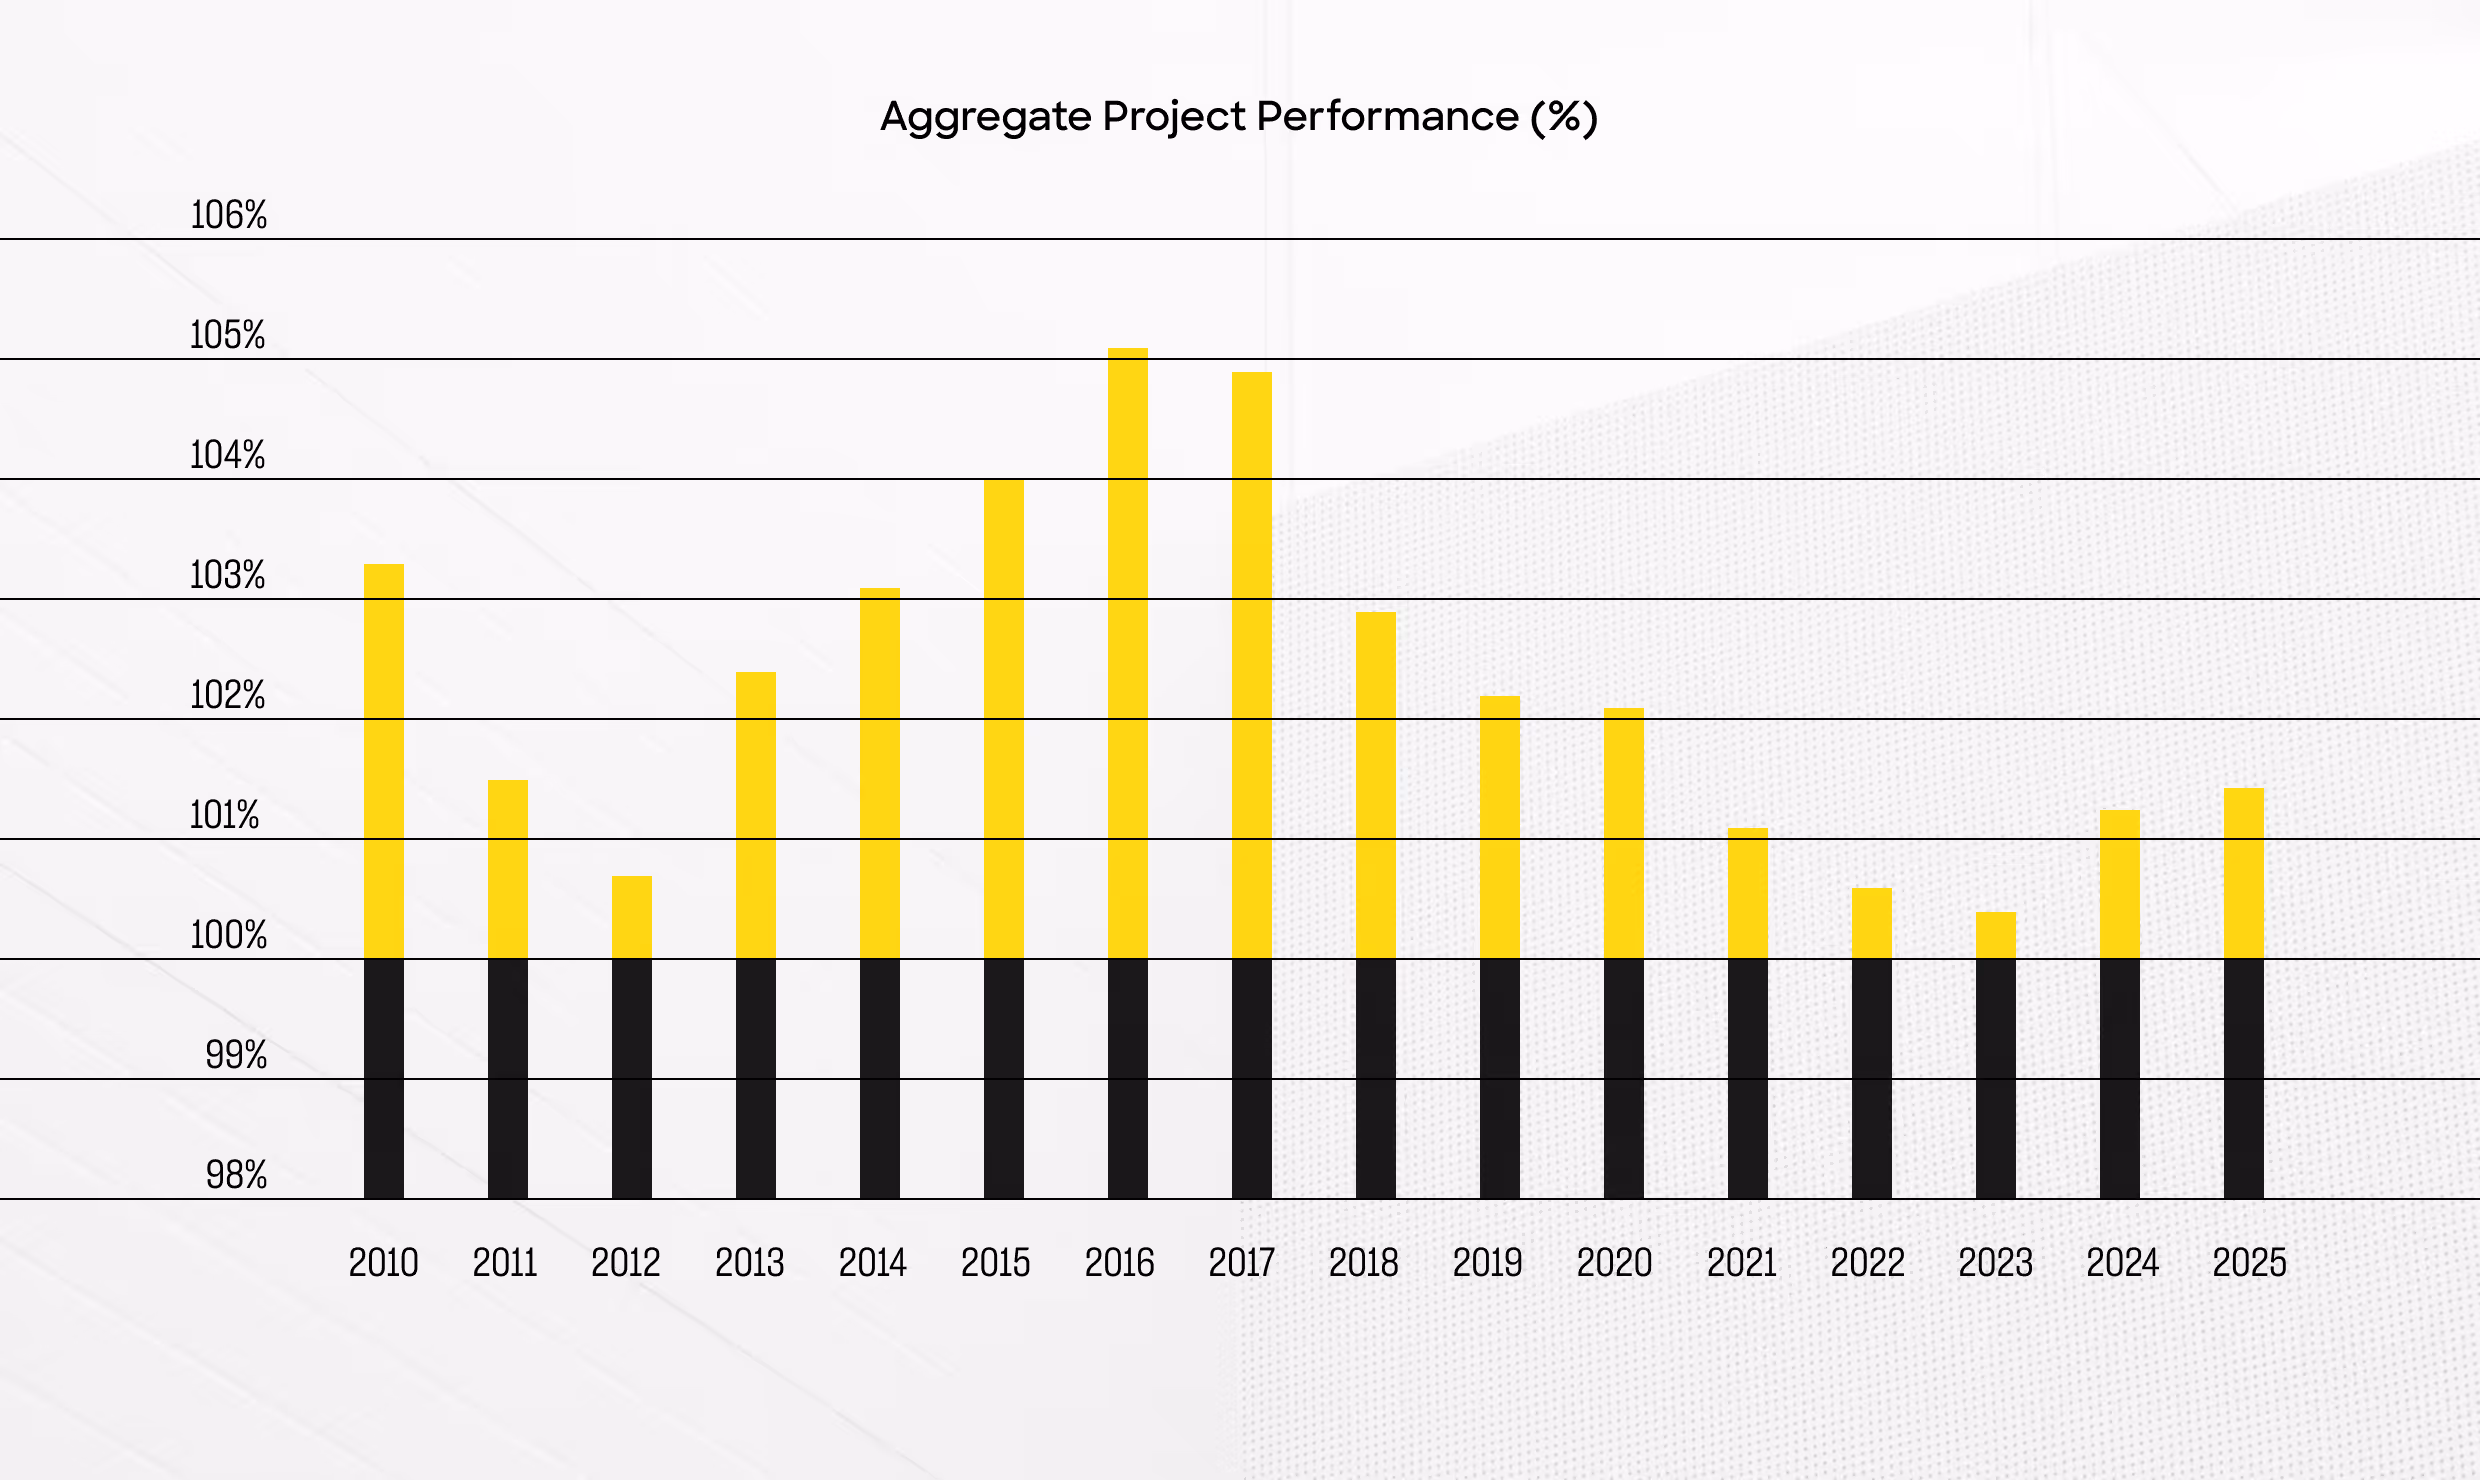
Annual Performance
Over the last decade, our realized savings have exceeded the expected savings (as projected in an initial energy audit) each year. On average, our portfolio performs at 101.6% of its expected savings.2
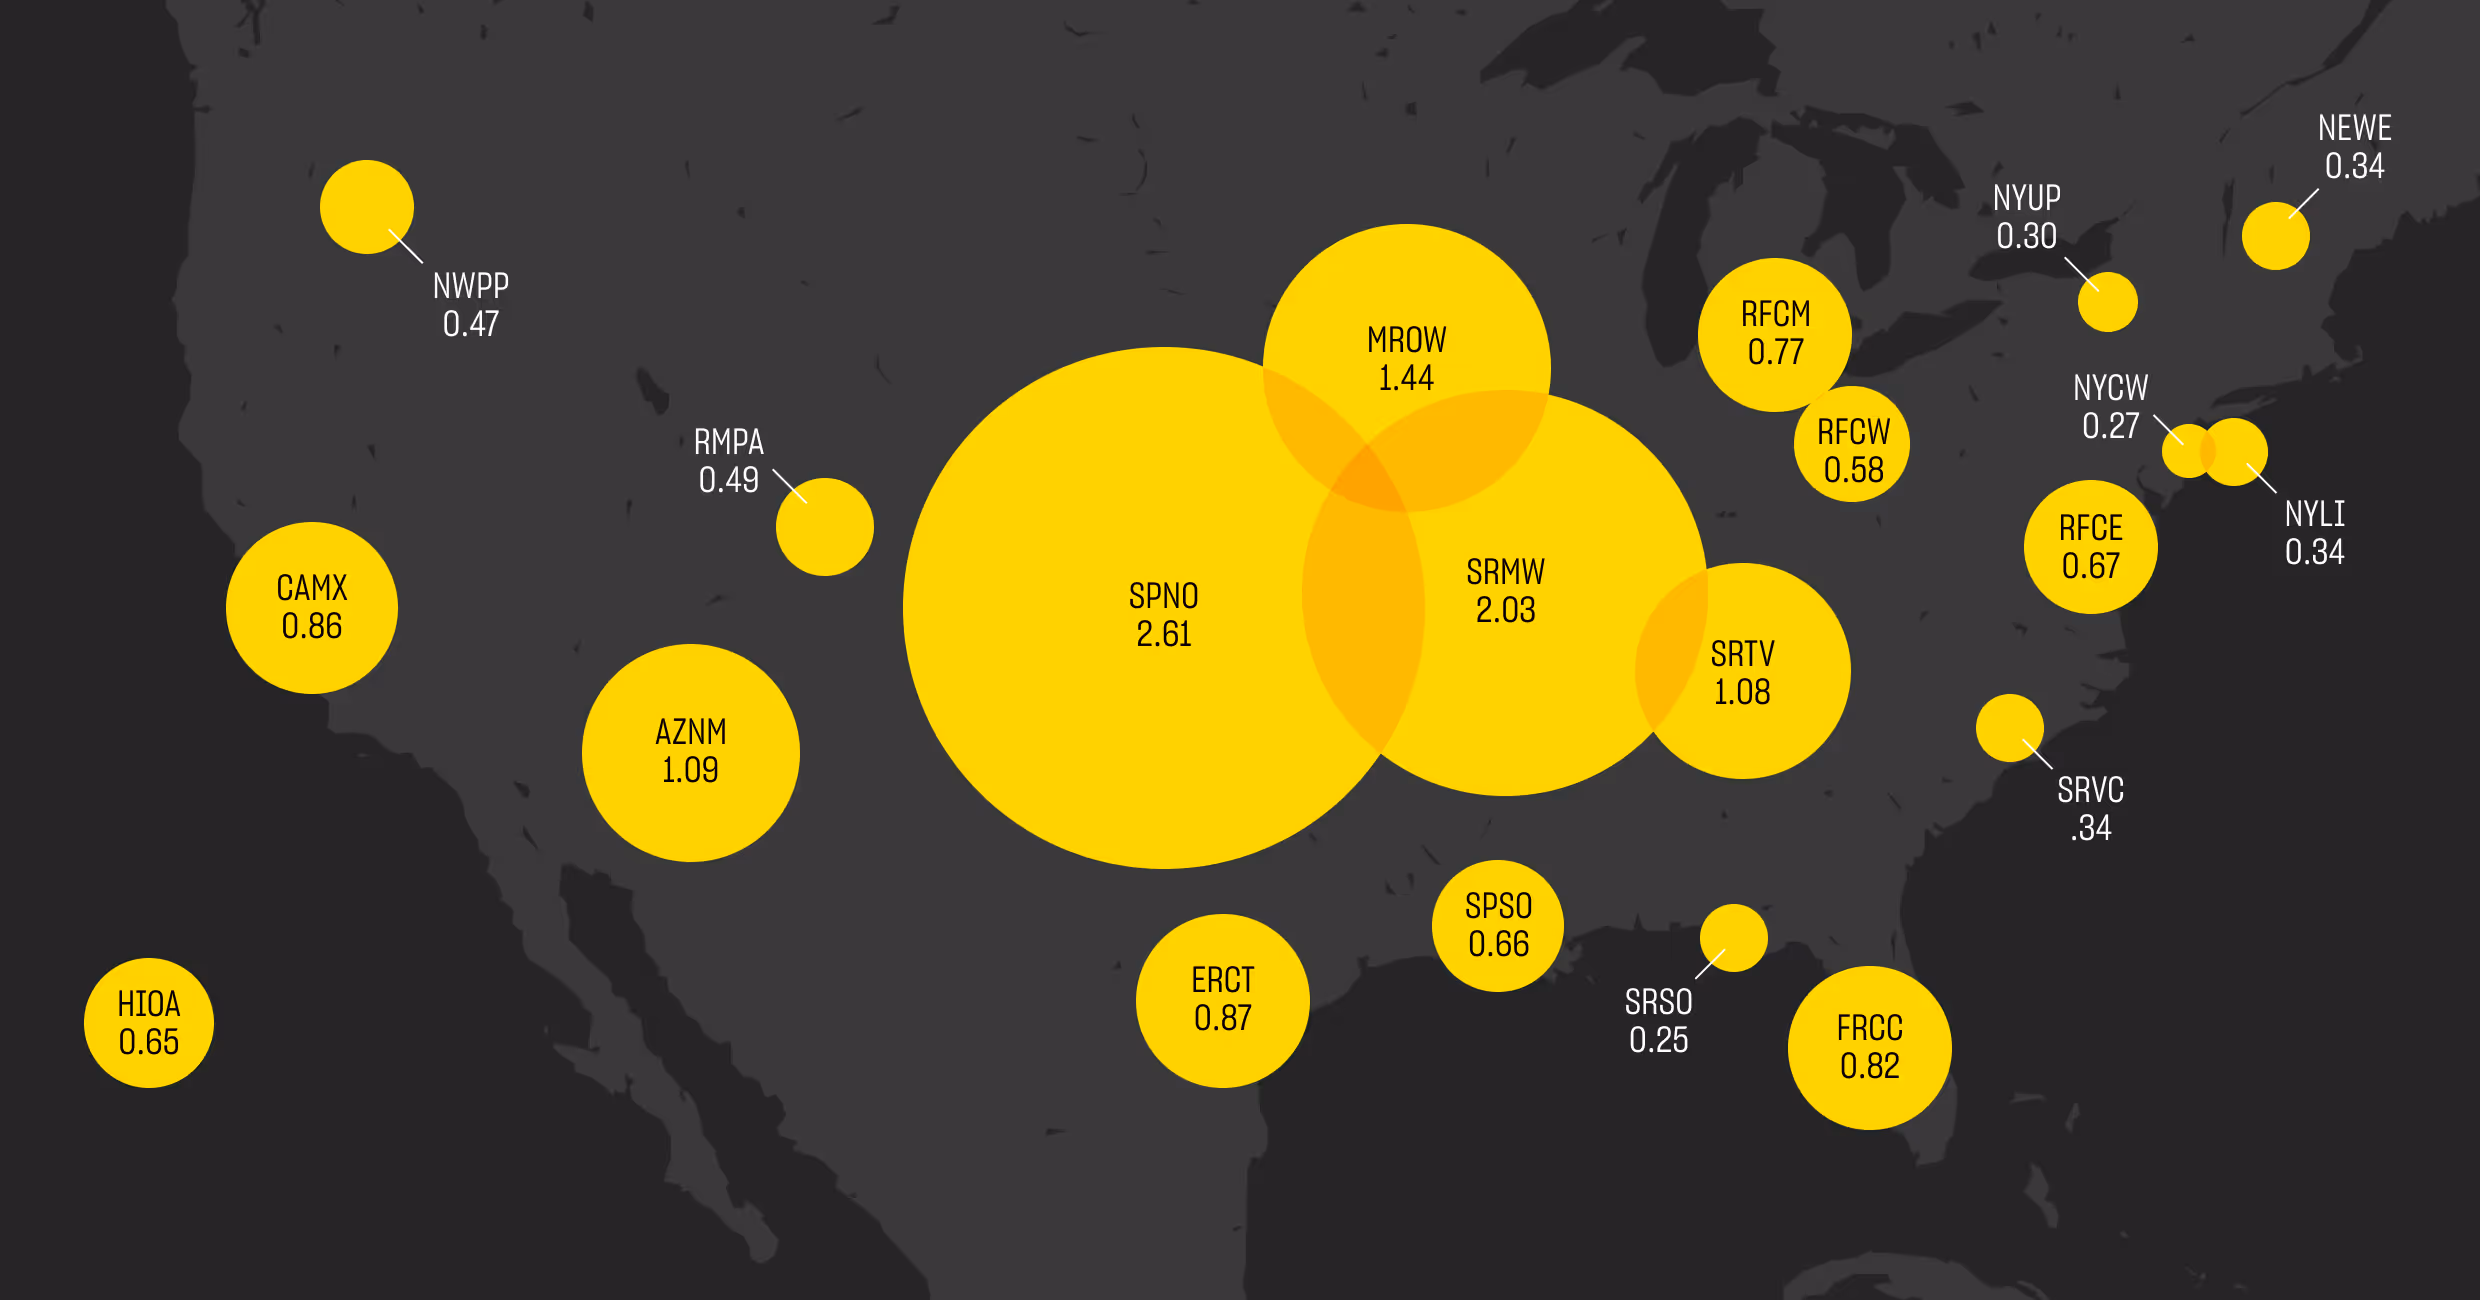
CO2 Savings per $1,000 of Investment
Metrus measures the efficiency of its investment portfolio in reducing CO2 (metric tons) by using CarbonCount™ as a scoring tool.3 Higher ratios mean greater carbon reduction per $1,000 of investment.4 The data below represents the average scoring for Metrus projects located within 21 different regional eGrid zones.5 Our investments in the SPNO and SRMW zones have the highest CO2 efficiency ratings due in large part to the higher carbon content in the midwestern power grid.

Environmental performance is interwoven into each of our projects. We prepare annual reports that detail project-level CO2 savings broken out by Scope 1 and Scope 2 emissions to facilitate customer reporting under SBTi.6
This is also our third year of reporting on Metrus’ annual reduction of sulphur oxide (SOx) and nitrogen oxide (NOx), atmospheric pollutants caused by burning fossil fuels.
Lifetime CO2 Savings Across Our Portfolio

819,210
That’s the equivalent of 28,447 cars being taken off our roads each year.8

2025: Annual CO2 Savings

40,230
9
Direct emissions that occur at an organization’s location (e.g., natural gas-fired furnaces, oil-fired boilers, etc.)
1,807
annual metric tons of CO2 saved
Indirect emissions that are generated elsewhere in service to an organization (purchased or acquired electricity, steam, etc.)
38,423
annual metric tons of CO2 saved

2025: SOx and NOx
In addition to reducing greenhouse gases, our efforts to accelerate the transition to a sustainable, low-carbon future directly reduce atmospheric pollutants such as sulfur dioxide (SOx) and nitrogen oxides (NOx). In 2025, Metrus reduced SOx emissions by 18 metric tons and NOX emissions by 27 metric tons. These reductions are helping to achieve the levels set forth in the EPA’s National Ambient Air Quality Standards (NAAQS).
27
18
2025: Total Annual Energy Savings
Our projects include a wide range of energy-efficiency improvements that generate both electric and thermal energy savings.10
In 2025, our portfolio saved a total of 428,035 MMBtu of energy. That’s equivalent to 73,799 barrels of oil.11

117,756,134
262,506
2025: Total Water Savings
According to the EPA, office buildings, hospitals, hotels and schools, among other commercial and institutional facilities, use 17% of the public water supply, making the sector the 2nd largest consumer in the country.12
Metrus has projects with water efficiency measures across private sector business, higher education, and healthcare customers. According to the EPA, each American uses an average of 82 gallons of water per day at home. So, the 77,434,253-gallon reduction in water consumption is equivalent to the water used by 2,587 Americans for an entire year.
77,434,253
University of Northwestern Ohio
CarbonCount = 0.31
.png)
Major US Airport
CarbonCount = 0.06

Bristol Hospital
CarbonCount = 0.29
.svg)
A holistic look at our overall carbon impact, including Metrus’ own emissions.
While we maintain a low energy profile within our own built environment, we take responsibility for the impact of Scope 3 emissions for assets that we own and install on behalf of our customers. Our goal with this report is to provide complete transparency into the energy savings and environmental impact of our business as well as our project investments.
Our Scope 1 Emissions
Metrus generates no direct emissions from fuel combustion.
0
Our Scope 2 Emissions
For its office space, Metrus purchases utilities that produce emissions.
18
Our Scope 3 Emissions / Travel
For employee travel and commuting, Metrus generates a nominal amount of emissions.
141
Our Scope 3 Emissions / Assets
Metrus’ project assets consume energy and produce CO2, albeit more minimally than the equipment they replaced.
16,486
Total
16,644
Our Net CO2 Savings
40,230
-
16,644
=
23,586
Metrus is committed to accelerating and scaling climate action by financing, owning, and operating sustainable energy projects.
Seventeen years ago, we introduced a groundbreaking finance solution that enables companies to decarbonize and reduce their environmental impact with no upfront cost. We remain steadfast in our mission to drive climate action by financing, owning and operating sustainable energy infrastructure upgrades and accelerating the transition to a sustainable, low-carbon energy future. We’re living at a pivotal time when investment, innovation, and decisive action can make a real difference and we’re fully committed to driving progress and being accountable.
Our Partnerships

$300 million
The Department of Energy’s Better Buildings Challenge is a partnership of businesses, manufacturers, cities, states, universities, and school districts committing to improve the energy efficiency of their buildings by at least 20% over 10 years. Metrus was one of the first financial allies to join this program. After exceeding our first two commitment goals, we’ve recently reupped our target to $300 million.

$200 million
The America Is All In initiative (formerly We Are Still In) is a diverse coalition of U.S. leaders who support halving U.S. emissions by 2030 and reaching net zero emissions by 2050. As part of this ongoing initiative, Metrus increased its financing commitment from $100 million of sustainable energy projects to $200 million and is now 43% of the way towards its new target.

$100 million
The Cool Coalition is a partnership of proactive governments, businesses, and civil society organizations that aims to accelerate progress toward efficient and climate-friendly cooling. Metrus joined the coalition in 2023 in order to promote the adoption of environmentally friendly cooling technologies and to facilitate equipment upgrades through its Energy as a Service financing solution. As part of the first-ever Global Cooling Pledge announced at COP28, Metrus has committed $100 million in sustainable cooling projects.
.png)
In 2021, Metrus became a signatory to the internationally-recognized Principles for Responsible Investment (PRI), publicly demonstrating our commitment to responsible investing, at a global level. We join an international cadre of investors and asset owners who believe that an economically efficient, sustainable global financial system is a necessity for long-term value creation
.png)
In 2023, Metrus joined Mission Efficiency in their pursuit to accelerate the transition towards energy efficient economies worldwide. Mission Efficiency is a collective of actions, commitments, and goals from a coalition of governments, organizations, and initiatives coming together to drive progress on energy efficiency, and Metrus is providing strategic support on key issues in the US.

The Business Council for Sustainable Energy (BCSE) is a coalition of companies and trade associations that deploy clean energy and decarbonization solutions, with a sector focus on energy efficiency, natural gas, and renewable energy, in addition to energy storage, sustainable transportation, and more.
The Alliance promotes energy efficiency to achieve a healthier economy, a cleaner environment, and greater energy security and is a bipartisan, nonprofit coalition of business, government, environmental, and consumer leaders advocating to advance federal energy efficiency policy.

Metrus Energy has joined a global coalition of more than 170 organizations in signing the first-ever Global Pledge for Healthy Indoor Air. The pledge, launched at a United Nations Side Event in September, is the first international effort to formally recognize clean indoor air as a basic human right essential to health and well-being.
Diversity and Inclusion
Metrus is dedicated to creating a diverse and inclusive work environment. We respect and learn from different viewpoints and lived experiences. We welcome, support, and benefit from the perspectives of people who differ in race, culture, ethnicity, gender identity, physical ability, religion, and sexual orientation. We believe that having diverse employees, business partners, and community relationships is vital to delivering our services and achieving our mission of bringing energy efficiency and clean energy projects to life. At Metrus, diversity of thought and experience is respected and viewed as essential to excellence.
References
1) Sites are unique locations that may be incorporated in multiple projects.
2) Performance is determined by measured and verified savings using Efficiency Valuation Organization International Performance Measurement and Verification Protocol (IPMVP): https://evo-world.org/en/products-services-mainmenu-en/protocols/ipmvp. Each calendar year may not align with a project’s annual period; therefore savings are weighted between calendar years based on the project’s substantial completion date.
3) Hannon Armstrong’s CarbonCount™ was used to calculate CO2 (metric tons saved annually) / $1,000 invested:https://www.hannonarmstrong.com/esg/carboncount/
4) Each $1,000 investment represents the cost of installing the energy efficiency upgrades in that eGRID region.
5) U.S. EPA eGRID regional emissions data: https://www.epa.gov/egrid/power-profiler#/
6) U.S. EPA eGRID Scope 1 and 2 Emissions: https://www.epa.gov/greeningepa/greenhouse-gases-epa.
7) All conversions into CO2 are based on U.S. EPA eGRID regional emission data: https://www.epa.gov/egrid/power-profiler#/.
8) U.S. EPA Greenhouse Gas Equivalencies Calculator: https://www.epa.gov/energy/greenhouse-gas-equivalencies-calculator.
9) This total includes 9,617 metric tons of avoided CO2 through assets that Metrus has financed but does not own.
10) Savings in 2025 are determined by measured and verified savings using IPMVP when available. Otherwise, expected savings are included. In instances where the calendar year may not align with a project’s annual period, savings are weighted between calendar years based on the project’s substantial completion date.
11) Electricity, natural gas, and fuel oil savings were individually converted to MMBtu, and total MMBTU was converted to equivalent barrels of oil using data from the U.S. EPA: https://www.epa.gov/energy/greenhouse-gases-equivalencies-calculator-calculations-and-references#oil.
12) U.S. EPA WaterSense: https://www.epa.gov/watersense/types-facilities.